Version 2024 of Spectrus Processor JS includes improvements in display and reporting of structures of MS and chromatographic traces. Read below for details, and contact us for help upgrading your software.
Display Annotations of 1D Curves in 2D NMR Spectra
- You now have the option to display the annotations of 1D curves in 2D NMR spectra

View chemical shift and 1D curve annotations on 2D NMR spectra.
Improved Solvent and Reference Mode for 1D and 2D NMR Spectra
- You can now more easily reference spectra and edit dark regions
Manually Create Average Spectra
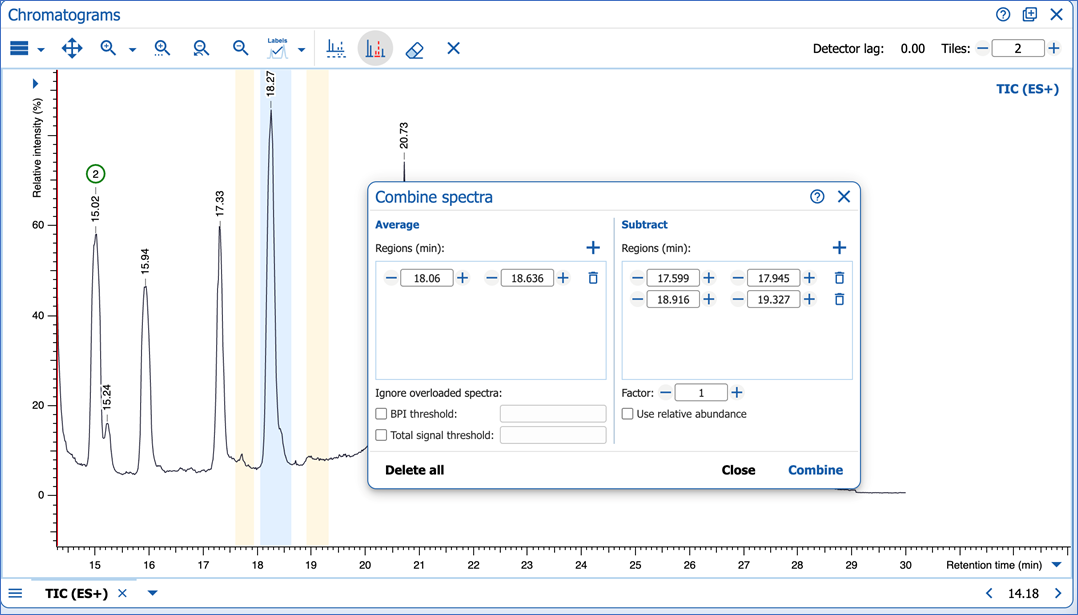
You have more control over your data processing with improved tools for manually combining/averaging spectra
- Setup average/subtract regions using the Combine spectra dialog box
- Select the regions to average on the chromatogram directly

Manually adjust averaged MS scans using the Combine spectra dialog box, enabling you to setup specific average/subtract regions.
Improved Overlay Mode
You can now streamline your MS analyses with improved overlaid spectra
- View overlaid MSn spectra by selecting nodes in MSn tree
- View mass spectra in mirrored mode
- ove and scale overlaid curves individually
- Choose a specific UV scan to add to overlaid curves

Select which UV scan to add to overlaid curves using the chromatogram panel.
Improved MS Reporting Features
You can expect even greater flexibility in the dynamic reporting features of Spectrus Processor JS, making report generation even more streamlined and efficient.
- View spectral parameters of individual MS scans
- Dynamically update the spectra in your report to reflect any changes made to the MS scans in the Dashboard
- Conveniently combine spectra from different datasets to create one report
Greater Flexibility in Working with MSn Spectra
You can now easily include MSn spectra in your reports with greater flexibility using the MSn spectrum template.
- Filter in the MSn Tree to specify which spectra to select and display (MSn level, retention time and parent m/z, fragmentation mode, and collision energy)
- Select which MSn spectra to display in reports using the MSn Tree

Select which MSn spectra to include in your report using the MSn Tree.
Interface Improvements
- Display spectral metadata as a watermark in the background of spectra
- Customize font size in table widgets, on the dashboard, and in reports
Improved Structure Label Options
- Improved visualization with clearer structure label options and the ability to customize these in the report
General Report Improvements
- Choose to add a structure to each page of the report
- Choose to reflect your display options for structures, spectra, chromatograms, and multiplet reports from the Dashboard in corresponding objects in your report
Learn More or Request a Trial
Request a free trial of of Spectrus Processor JS, or contact us for help upgrading your software.

