Data Import
- You can now import data from the following formats:
- MS data from Bruker TIMS TOF (*.tsf)
- GC data from Shimadzu (*.gcd)
- We improved data import from:
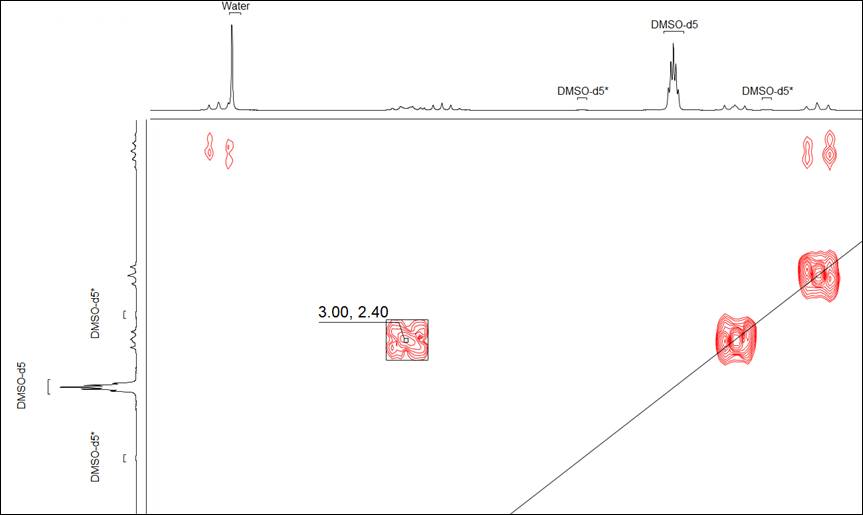
- Standard BMRB bioNMR (*.seq and *.bmrb) biosequence structure and assignment data is now transferred to C-H correlation spectra (HSQC and HMQC), in addition to the previous N-H HSQC
Improved Analysis of Large Molecules through Multiply-Charged Ion Fragmentation
You can now use multiply-charged precursor ions in fragmentation analysis and optionally analyze multiply-charged product ions which often occur in the analysis of peptides and biomolecules.
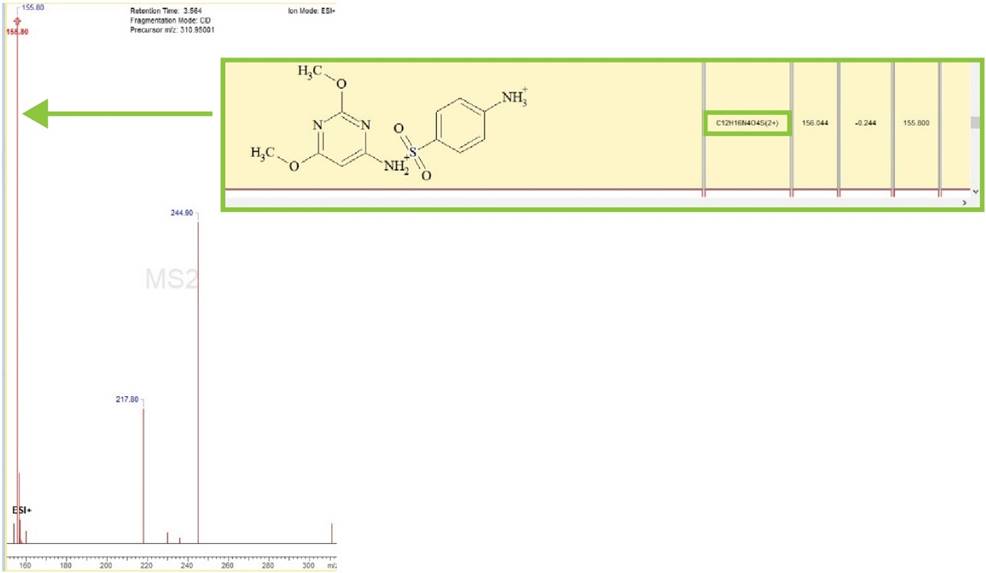
Generation of multiply-charged fragments, indicated in the green box and highlighted on the MSn spectra.
Improved Display and Reporting of Structures on Chromatographic Traces
- You now have the option to selectively display structures on chromatographic traces, consolidating information in one place. This feature allows you to control which structures to display and include in reports.
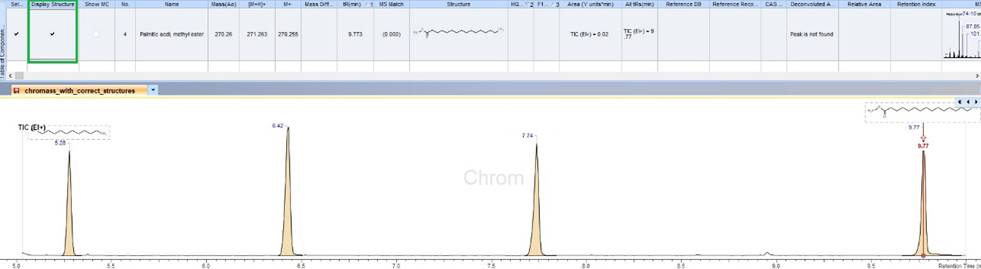
Display selected structure(s) on chromatographic traces.
Simplified Analysis with Reoccurring Ions
- You can now add reoccurring ions to the Component Interpretation Options, allowing you to automatically search and label reoccurring ions when assigning a component
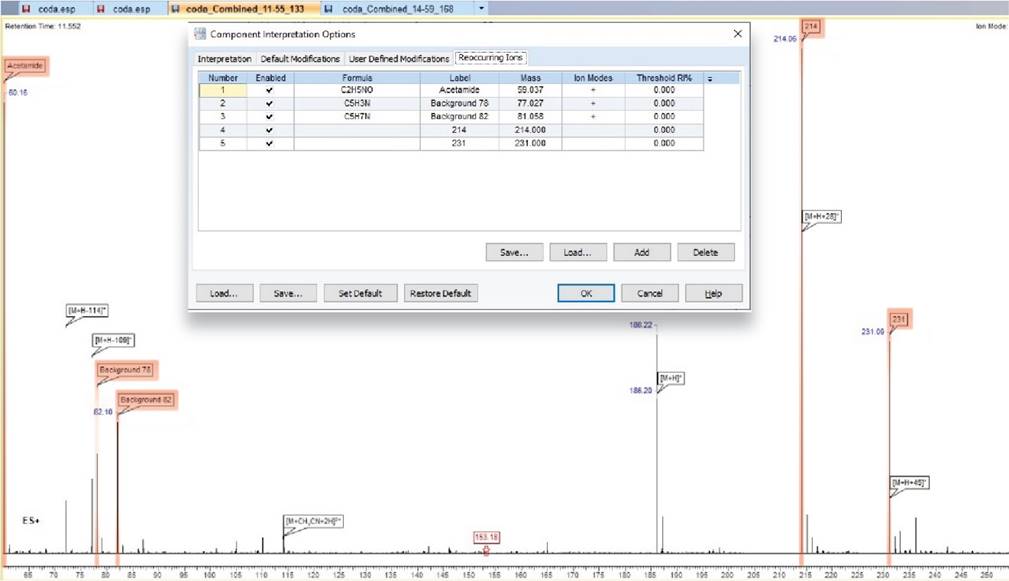
Highlighted ions are those populated in the reoccurring ions tab and are clearly labeled on the spectrum for ease of interpretation.
Greater Confidence in Identification with Improved MS Match Score
- You can now include multiply-charged ions and/or modifications into your MS Match score, giving you greater confidence in identification
Easier Analysis of Biomolecules and Peptides
You can now execute cleavage of disulfide and amide bonds with new fragmentation rules.
Improved Accuracy of Peak Areas
You can now perform peak fitting of hyphenated data.
- Extract more accurate peak areas and visualize results chromatographically and in tabular format
- Include both full and deconvoluted areas in reports
Process Extensive Lists of Targets More Quickly
IntelliTarget can now handle large lists of targets and process data up to 5 times faster.
Easier Review of Metabolites
Table of Metabolites now includes both Molecular Formula (MF) and Structure columns enabling facile review.

Molecular formula and structure columns for each metabolite can be viewed in the Table of Metabolites.
Improved Reporting Functionality
We have added more options for reporting functionality including:
- Ability to include full and deconvoluted areas in reports
- Ability to zoom to a defined region around an MSn Precursor
- Report “All” wavelengths for flat UV traces inside hyphenated datasets
- Display multiple descriptors on peaks in flat chromatograms such as retention time and name
Improvements in Quantitation
You now have access to new options for improving quantitation including:
- We now support Sciex data (*.wiff) file format in quantitation projects
- Calculate your unknown quantities more quickly with capabilities to:
- Populate concentration, volume, and mass columns when setting up your project by copying/pasting values (single cell, or columns) from Excel
- Move more quickly between cells with the use of keyboard prompts (i.e., the arrow keys, Enter or Space)
- Quantitate true analyte amounts by performing blank subtraction
- Standardize repeat measurements by normalizing data to internal standards
- Store data in a remote database to leverage knowledge across an organization
Improvements in Component Interpretation (IXCR)
You can now review more data in one place with options to:
- View Retention Indices (RI) from NIST MS Libraries in the Table of Components with your hits to aid in assigning confidence to the hit
- Optionally display a selection, or all the RI values
- View CAS Registry Numbers in the Table of Components from User Databases, providing a unique identifier
Improvements in the Use of Internal Standards in Hyphenated Data Sets (LC/UV/MS, GC/MS)
- You can now calculate relative areas for all components if one component is selected as the internal standard
Easier Export of Components to Excel
- You now have the option to selectively push results including structure and molecular formulae from the Table of Components to Excel
Improved Accuracy in Area Calculations
- Using improved peak picking for XICs you can now manually adjust the border and/or baseline of peaks on XIC traces
Improved Efficiency of MS Data Processing
- You can now use preset options for Profiles to link instruments to specific accuracy, reporting, preferences, and script settings
- Set known parameters by instrument to minimize errors and improve efficiency
Improved Visualization of MS and UV Spectra
- You can now more easily review data with fixed positions for UV and MS Spectra
- Component Spectra are permanently fixed on the left and scan spectra are on the right
Improved Regulatory Compliance
You can easily store and visualize XIC accuracies and identify the accuracy used to extract XICs.
- Optionally display accuracies in the LC/UV/MS legend, in the chromatogram legend, and appended to the chromatogram name
- Visualize any accuracy changes in the History Record
- Store and display XIC accuracy in Spectrus DB, and visualize in reports
Ease of Use Improvements
- Set Mass Accuracy for data processing in Da or ppm
- Quickly find metabolites of interest by sorting the Table of Metabolites by multiple columns by pressing “Shift + click”
- You can access all available options in mass spectral right-click menus at once
- Quickly restore your zoom with a new hotkey for zoom undo (“U”)


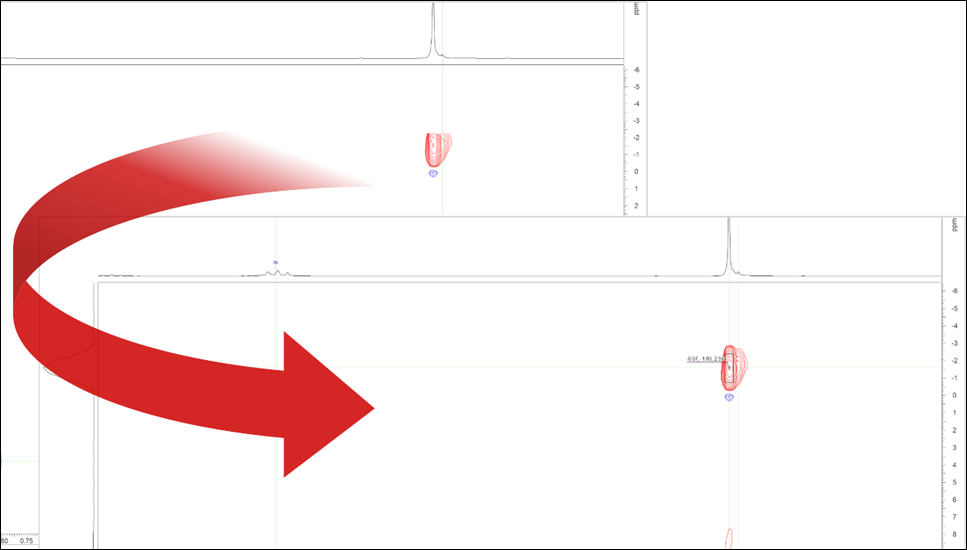
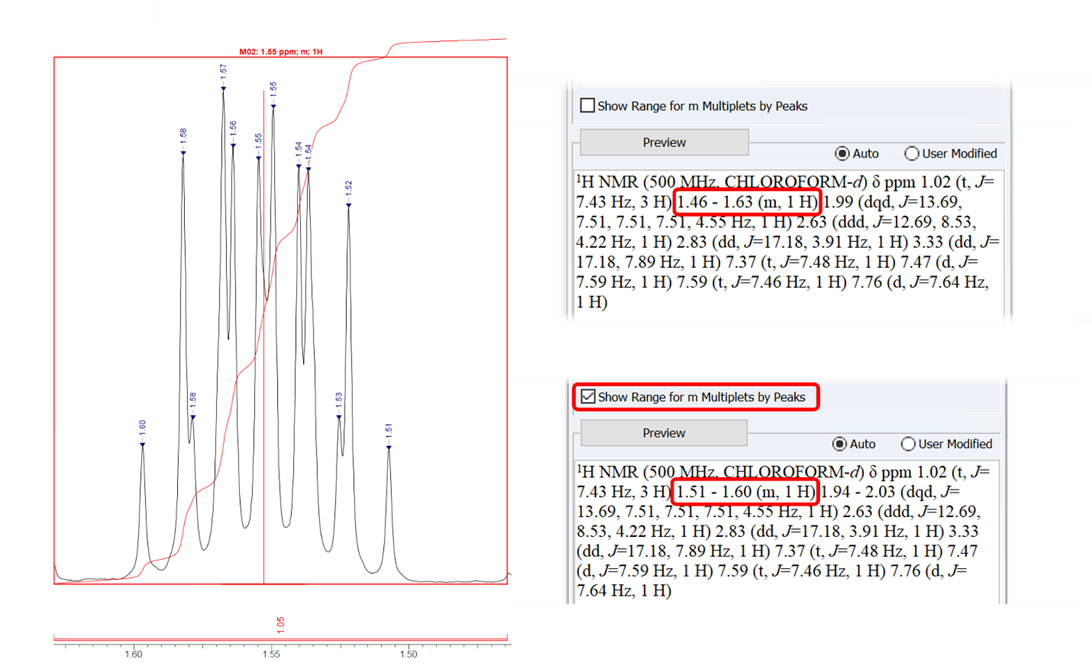 Choose to report multiplet ranges according to the outermost peaks or the boundaries of the integration—either 1.51–1.60 (m, 1H) for the outermost peaks with the option checked (above), or 1.46–1.63 (m, 1H) according to integration boundary (below).