

Version 2024 of Luminata adds new features including support for accelerated stability studies, simplification of data entry, and an array of new features to the web client. There are also improvements to the way you can search and visualize data. Read below for details, and contact us for help upgrading your software.
Support for Accelerated Stability Studies
You can now use experimental chromatographic data to build regression models (based on the Arhenius equation) and establish the shelf life and expiration date of drug products. Using the Accelerated Stability Assessment Program (ASAP) you can:
- Model the rate of chemical degradation over time, based on temperature and humidity
- Generate a PDF report
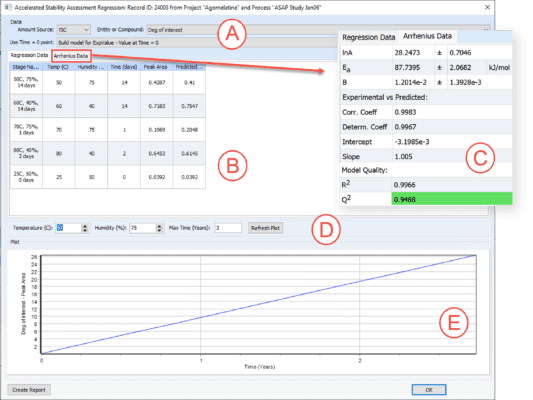
The Accelerated Predictive Stability Regression Analysis Wizard enables you to assemble all the information you need for accelerated stability studies and report your results.
A. Define the data source
B. Enter peak areas from the experimental data and the predicted peak areas for a given storage condition and time point
C. Review statistics associated with Double Linear Regression Analysis
D. Include storage conditions to predict degradant formation rate
E. Examine the regression plot stability line for the selected degradant
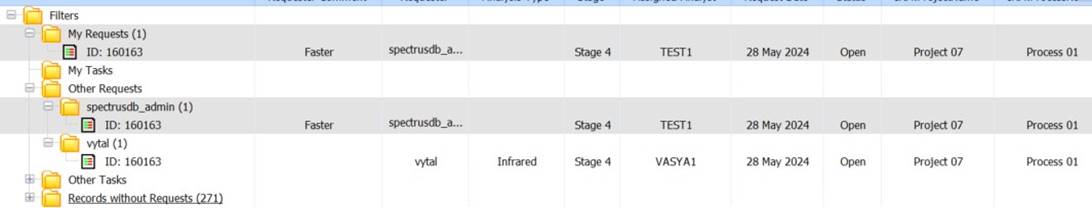
Easier Collaboration for Project Teams with Task/Experiment Assignment
You can now assign tasks or experiments for other team members and make requests in Luminata. Individuals on the project team can see assignments, accept tasks, update their status, and sign-off upon completion for a streamlined workflow.
Simplified Data Entry for Reactions & Analytical Data
- Select operations (stir rate, temperature ramp, time, etc.) from a pre-populated list to ease data entry for process chemistry data. You may also manually add operations for future use
 Select operations for eased reaction data entry from a pre-populated list (left). Hover over the stage in the process map to view unit operations for a reaction step (right).
- Attach analytical data from an existing record to a newly entered reaction
Streamlined Roll-Up of Master Data
You can now create master records by selecting from existing records in the database.
- Create a master synthetic route by selecting the best reaction conditions/operations from existing database records
- Populate a master record by interactively reviewing all records of a given reaction to select the optimal
More Flexible Data Entry from Mettler Toledo’s iControl
You can now manually add chromatograms (linked to Mettler Toledo’s iControl) directly from the instrument or from existing Luminata records.
Better Visualization of Your Data
- Alter the view of the Batch tree to indicate the data being reviewed in tables (i.e., Genealogy, Batch Impurity, and Batch description tables)
- Choose to view study maps in tile view
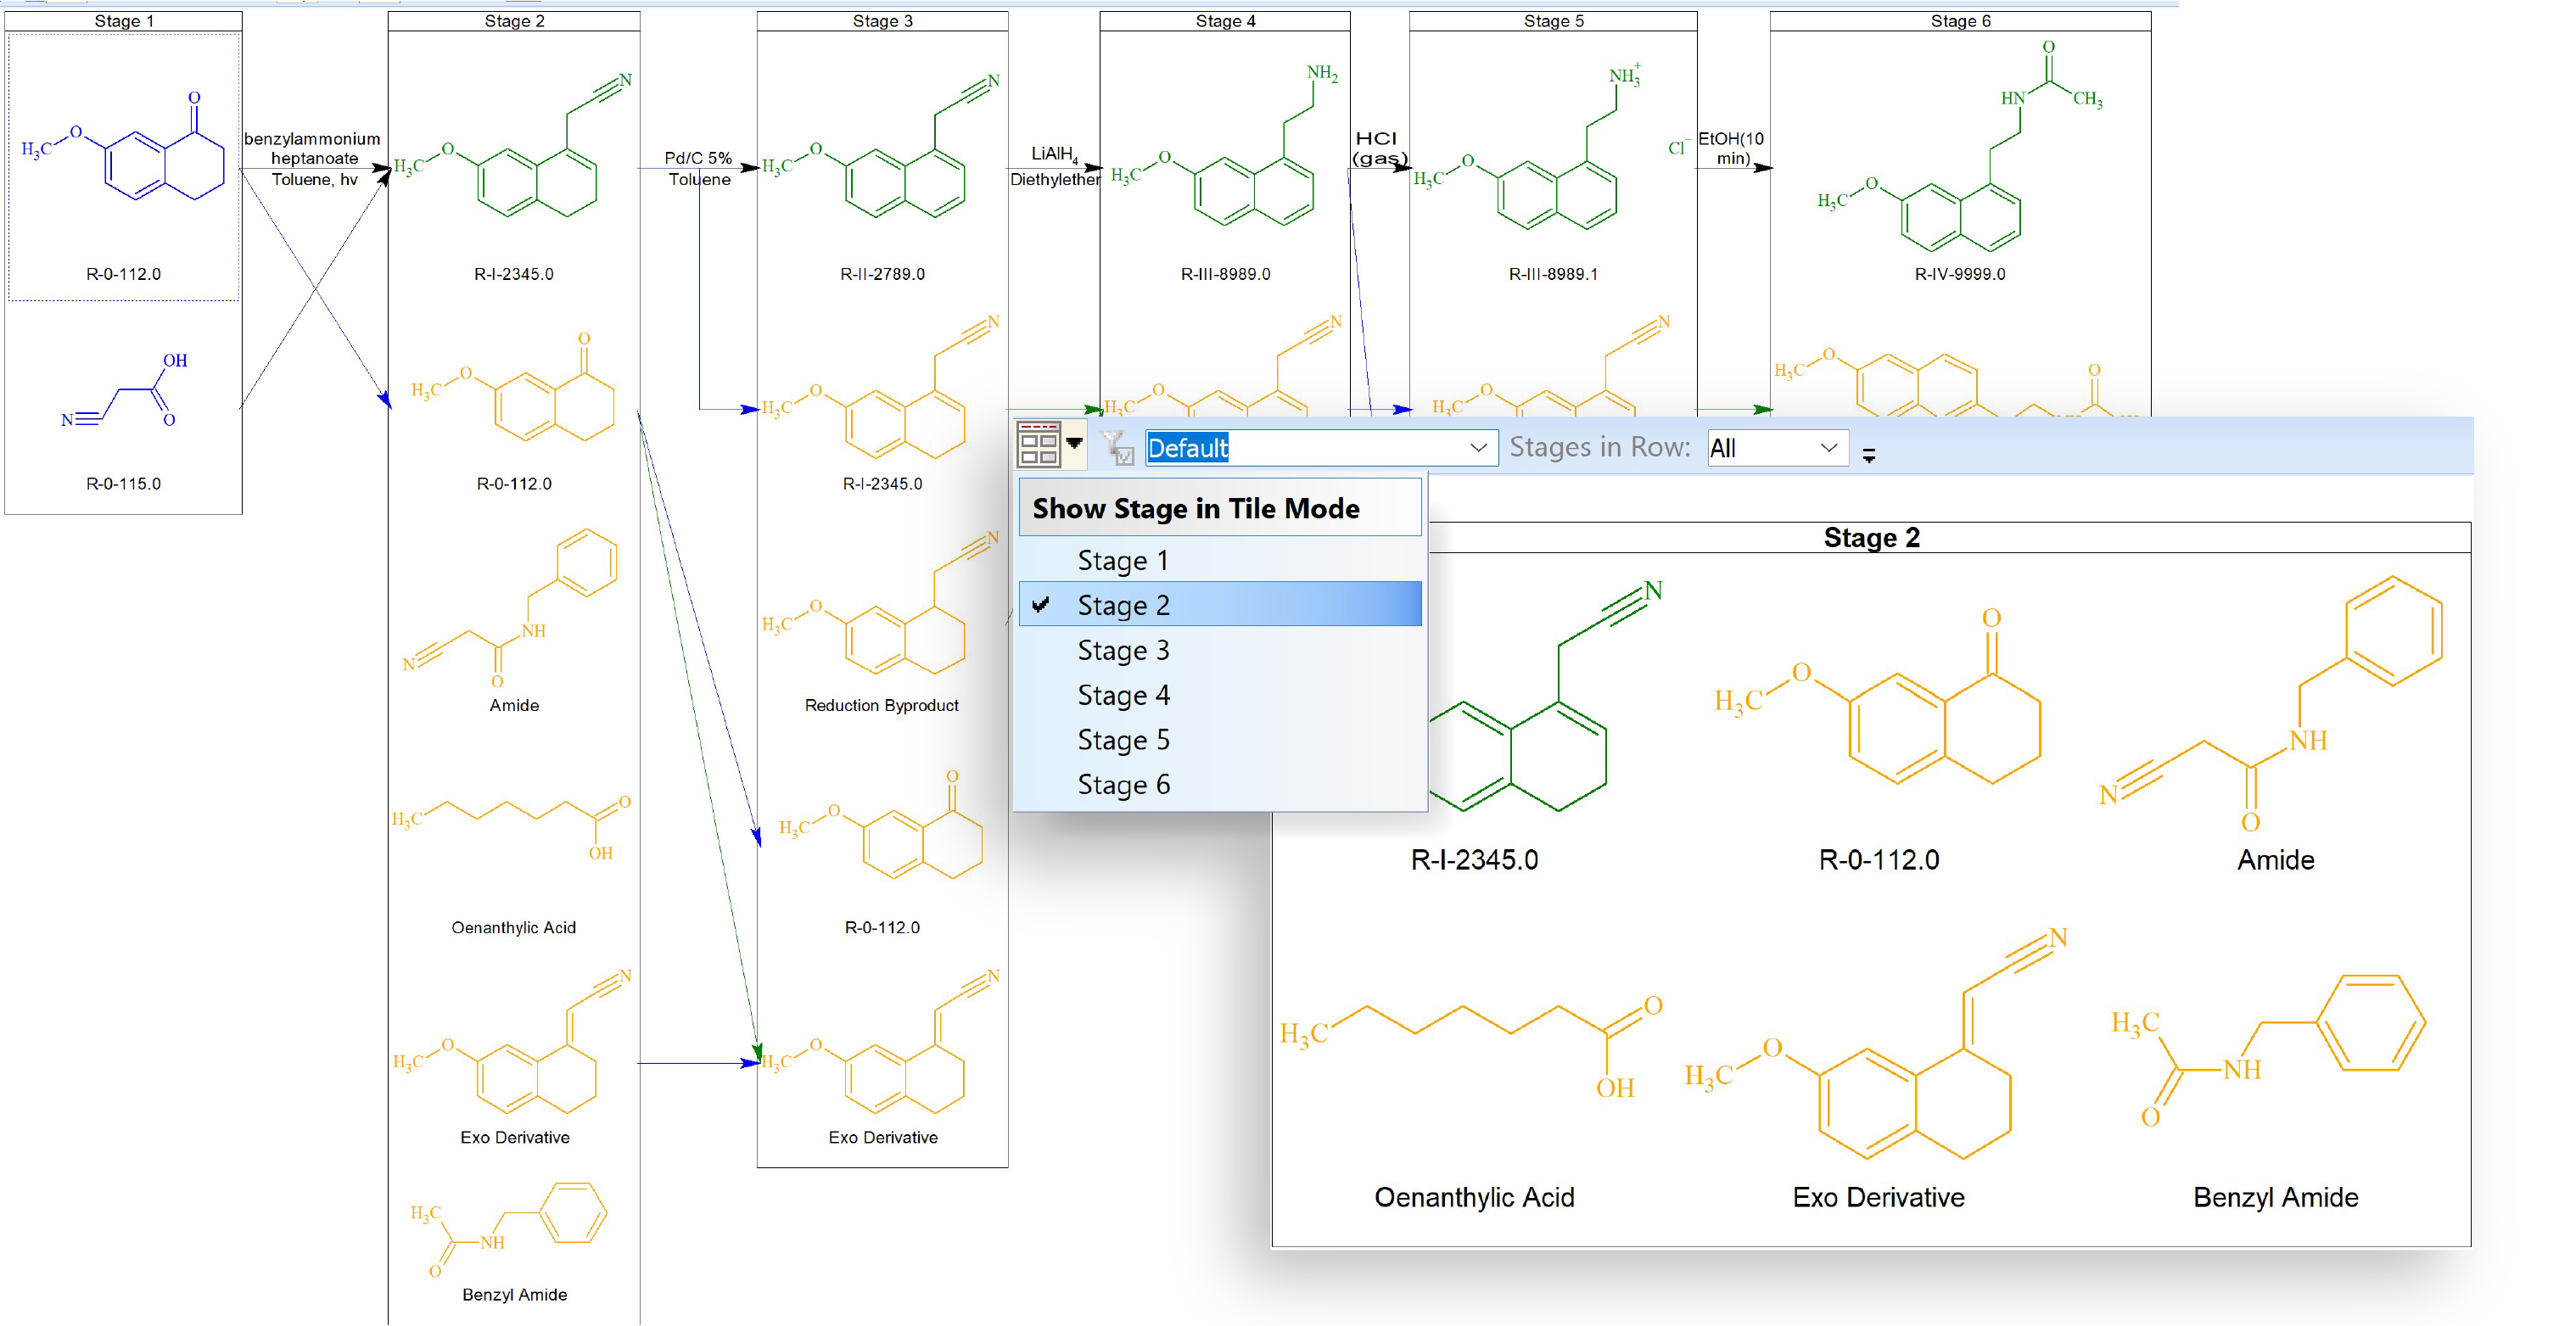 View study maps (left) in tile view (right)
- Visualize compound structures in the Batch Impurity Peak Amount Table previously, only compound names were populated
- Create bar graphs from filtered numerical values
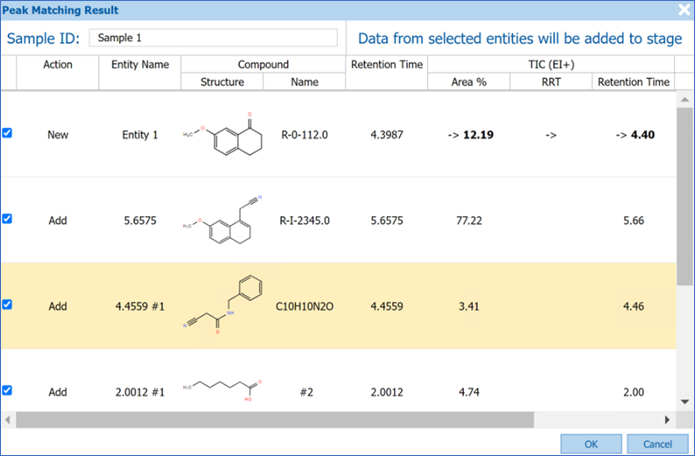
Resolve Chromatographic Peak Drift Across Multiple Records
You can now manually adjust retention time or relative retention time across multiple records.
Ease of Use
- View impurities based on relative amounts
- Hide long compound names in the table of samples
- Sort entries by relative Rt or Rt
Get Started with Record Creation Quickly with A Range of New Features
- Use the new ‘Shortcuts’ action dialog box to create new records quickly

- Import reaction schema from ChemSketch to build your process map

- Add reference analytical data and chromatographic data
Improvements to Data Visualization
- You can now view a variety of new data types and layouts in the web client. View:
- Project maps
- Forced degradation layouts
- Stability study layouts
- iControl layouts
- Custom layouts in the Compound record set
- Sub-levels within the navigation panel
- Specification levels for impurities in the graphs
More Comprehensive Search Capabilities
- Search structural and meta-data simultaneously
- Select multiple records when filtering relative amounts from a process and material studies to do comparative browsing
- Filter the Batch Genealogy Impurities Table, for greater flexibility when searching for chemicals
Data Import
- You can now import data from the following formats:
- MS data from Bruker TIMS TOF (*.tsf)
- GC data from Shimadzu (*.gcd)
- We improved data import from:
- Standard BMRB bioNMR (*.seq and *.bmrb) biosequence structure and assignment data is now transferred to C-H correlation spectra (HSQC and HMQC), in addition to the previous N-H HSQC
Export Data to Business Intelligence (BI) Interfaces
You can now create Oracle or PostgreSQL tables that can be queried by third-party applications (e.g., Spotfire). Select data you want to export to third-party decision-support interfaces via SQL.
Greater Flexibility in Selecting & Visualizing Queried Data
- You can now see select record information in Filter Tree view. Review filtered data and select the records of interest more quickly. (Previously you had to access individual records to view record information.)

- Choose the fields you want to be able to see in Filter Tree view (access via the screen forms editor)

- Choose the fields you want to be able to see in Filter Tree view (access via the screen forms editor)
- Dynamically visualize only your own records. Create a query to view records for the current logged in user.
Automatic Atom-by-Atom Mapping of Reaction Data for Comprehensive Query Results
You can now comprehensively search reactions or sub reactions for all relevant data. When you search a reaction or sub reaction, atom-mapping is automatically generated for the query and used in the search. (Choose to disable the atom-to-atom matching if/when you need.)
Improved Use of Web Links (URLs)
- Include weblinks (URLs) in tables

- Create a link for the current database record and copy it for use in other applications. (DB Read)
Example link: spectrusdb://%20/connect:localhost:7189,DB:%22Oracle%20DB%22,project:%22TEST%22%20/recid160284
Improved Search Capabilities
Monoisotopic Mass Included in Table of Search Results by Default
- You can now automatically see the ‘Monoisotopic Mass’ column in the Table of Search Results
New Compensated Offset Spectrum Similarity Search Method for NMR
- You can now better search for spectra where the query and the hit have very similar multiplet structures, but the peaks are shifted by different amounts. This shift is often seen between spectra recorded at different pHs or temperatures, and can now be accounted for with the new Compensated Offset method of HQI calculation

New Approximate Mode for 2D NMR Spectral Search
- You can now search for 2D NMR spectra without exact peak matches with Approximate Mode
- Similar to 1D spectra, this search mode ignores the number of peaks existing in the search zones in the query and hits. The HQI is then defined by the ratio of corresponding search zones in the spectra.
Server-Side Improvements
- Performance optimization and improvements to the Web REST API
- Log management is better—choose to archive/delete log files, limit file sizes, and more
- You may now choose to deny connections to old versions of desktop clients
- TLS 1.2 protocol is now supported for https Web API calls
- A new command in the Enterprise Server Management Console (ESMC) Record Sets panel “Refresh Selected Record Sets (F5)” enables you to refresh the status of select record sets
- The PostgreSQL DB server and ODBC client have been updated to version 15.5-1
You can also process analytical data in Luminata and we’ve improved analytical data processing features:
Processing Hyphenated MS Data with Luminata
Improved Analysis of Large Molecules through Multiply-Charged Ion Fragmentation
You can now use multiply-charged precursor ions in fragmentation analysis and optionally analyze multiply-charged product ions which often occur in the analysis of peptides and biomolecules.
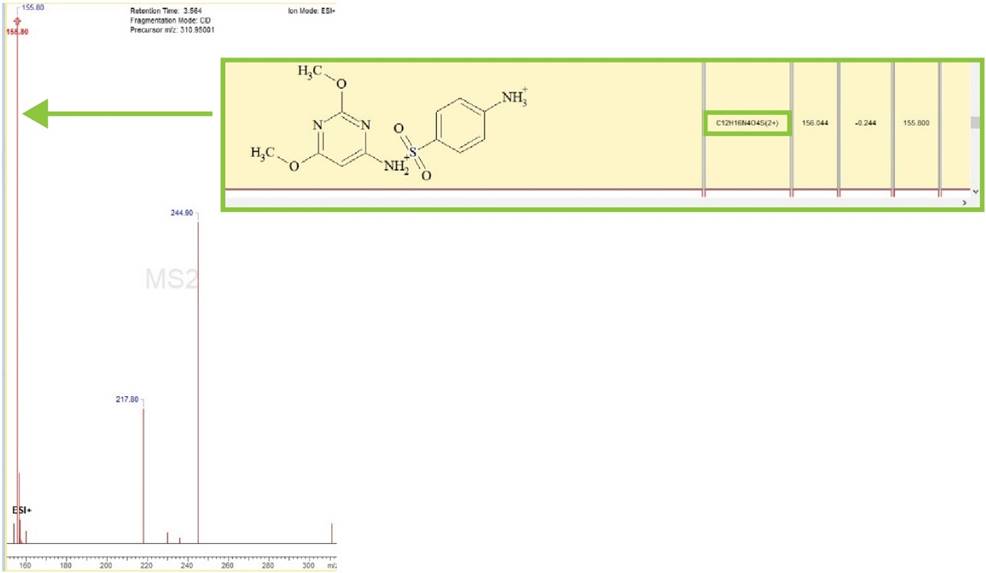
Generation of multiply-charged fragments, indicated in the green box and highlighted on the MSn spectra.
Data Analysis
Easier Analysis of Biomolecules and Peptides
You can now execute cleavage of disulfide and amide bonds with new fragmentation rules.
Improved Accuracy of Peak Areas
You can now perform peak fitting of hyphenated data.
- Extract more accurate peak areas and visualize results chromatographically and in tabular format
- Include both full and deconvoluted areas in reports
Improved Features
Improvements in Quantitation
You now have access to new options for improving quantitation including:
- We now support Sciex data (*.wiff) file format in quantitation projects
- Calculate your unknown quantities more quickly with capabilities to:
- Populate concentration, volume, and mass columns when setting up your project by copying/pasting values (single cell, or columns) from Excel
- Move more quickly between cells with the use of keyboard prompts (i.e., the arrow keys, Enter or Space)
- Quantitate true analyte amounts by performing blank subtraction
- Standardize repeat measurements by normalizing data to internal standards
- Store data in a remote database to leverage knowledge across an organization
Improvements in Component Interpretation (IXCR)
You can now review more data in one place with options to:
- View Retention Indices (RI) from NIST MS Libraries in the Table of Components with your hits to aid in assigning confidence to the hit
- Optionally display a selection, or all the RI values
- View CAS Registry Numbers in the Table of Components from User Databases, providing a unique identifier
Data Processing
Process Extensive Lists of Targets More Quickly
IntelliTarget can now handle large lists of targets and process data up to 5 times faster.
Reporting
Improved Reporting Functionality
We have added more options for reporting functionality, including full and deconvoluted areas in reports.
Processing NMR Data with Luminata
Option to Define the 1H Range of Multiplets Based on Peaks
- You now have the option to report the chemical shift range of multiplets based on the outermost peaks in the Multiplet Report Options dialog box, in addition to the boundaries of integration
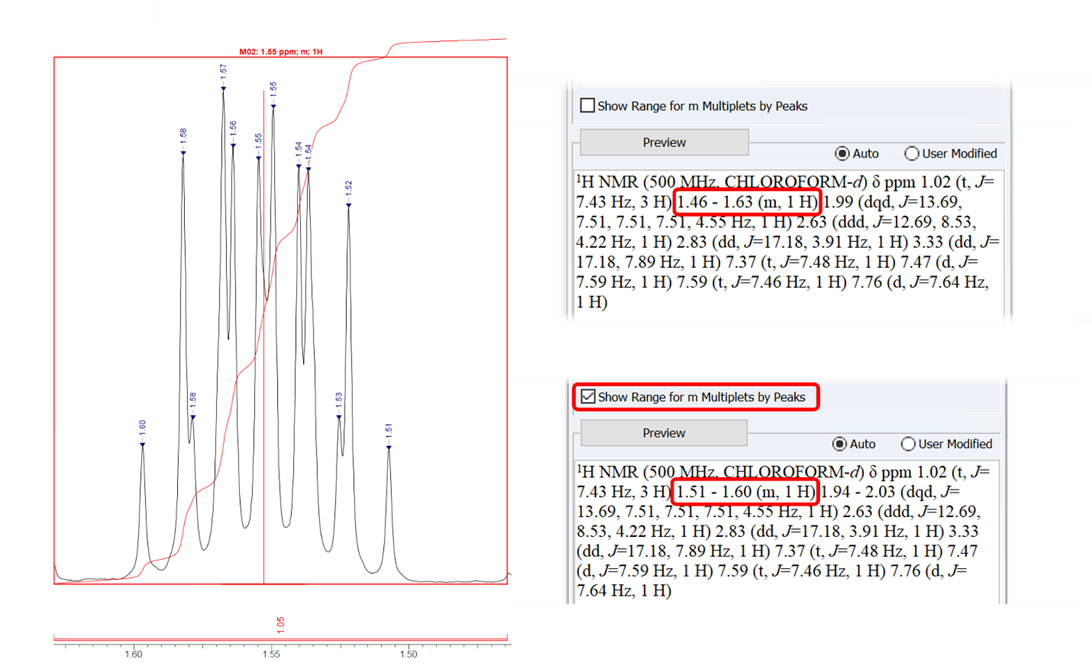 Choose to report multiplet ranges according to the outermost peaks or the boundaries of the integration—either 1.51–1.60 (m, 1H) for the outermost peaks with the option checked (above), or 1.46–1.63 (m, 1H) according to integration boundary (below).
Display Annotations of 1D Curves in 2D Spectra
- You now have the option to display the annotations of 1D curves in 2D NMR spectra
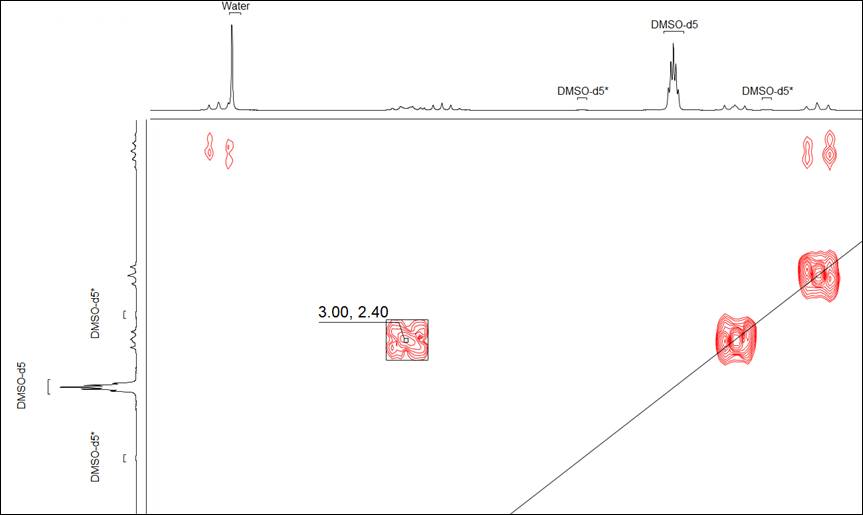
Show or hide the annotations of 1D curves in 2D NMR spectra.
Indication of Peaks Used for qNMR Calculation in Report
- You can now quickly identify which integrals are used in qNMR calculations with external standards in the Table of Integrals; which can now be included on the title page of the report
Option to Automatically Unfold HSQC Spectra for Structures with Si-CH3 Groups
- You now have the option to automatically unfold HSQC spectra along the F1 (13C) axis for structures with Si-CH3 This allows aliased peaks that are cut off to be picked properly.
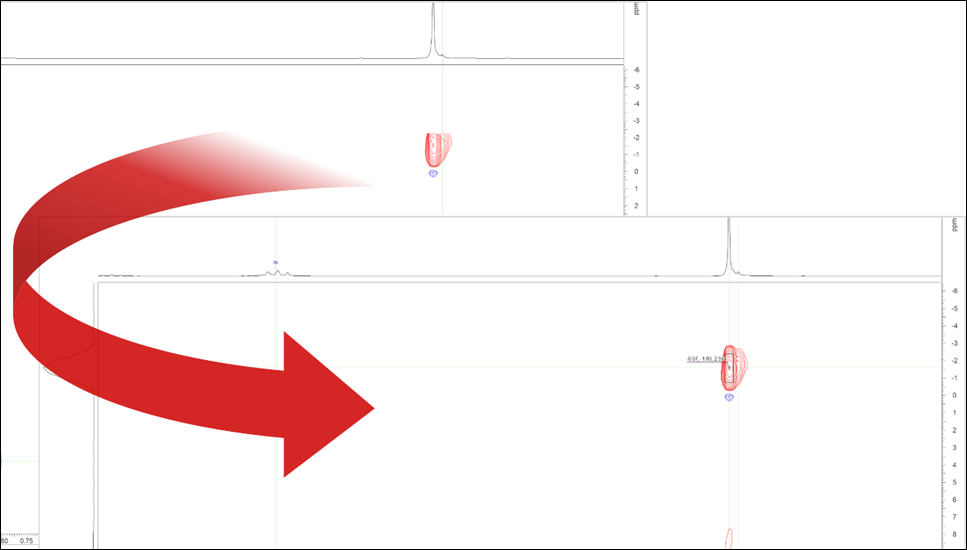
Automatically unfold HSQC spectra along the F1 for structures with Si-CH3 groups.
New Integral Normalization Method for NMR Spectra
- You can now more accurately normalize 1H integrals of samples with various impurities with the Allow Excess option
- This can help prevent false negatives in workflows like Automated Structure Verification (ASV)

The Allow Excess option method for 1H integral normalization can avoid under-estimated integrals when impurities are present in the sample, which helps prevent false negative results in ASV.
- This can help prevent false negatives in workflows like Automated Structure Verification (ASV)
Perform External Standard Concentration Calculations Without a Sample Structure
- You now have the option to perform qNMR external concentration calculations in cases where the structure of the sample is not available. Do this by entering the molecular weight of the sample in the Concentration dialog box.
Improved Metrics for External Standard qNMR
- You can now calculate the relative sample purity by weight (w/w%) automatically with the Concentration Calculation tool
- You can now include the concentration calibration parameters in your report
Option to Show Only Unique J-Coupling Constants in the NMR Spectral Data Table
- You now have the option to show only unique coupling constants in the Spectral Data Table Advanced Options menu
- Instead of reporting a triplet as t(5.25, 5.25), it can now be reported as t(5.25)
Improved Reporting Functionality
- Ability to manually edit the NMR multiplet report text before copying to the clipboard or generating a report
Want to learn more?
Read more about the full features of Luminata, or contact us for help upgrading your software.