Introduction
The algorithm offered by ACD/Labs for calculating pH-dependent octanol/water distribution coefficient (logD) is a highly accurate and robust method to evaluate lipophilicity of drug-like molecules at a variety of physiologically relevant conditions.
The unique feature of the underlying pKa predictor is its ability to account for all individual ionic forms present in the solution at given pH. This applies not only to the ionization profile itself, but also to all pKa-dependent property predictions, such as logD or logS.
However, exhaustive evaluation of all relevant microspecies comes with several tradeoffs:
- Calculation speed. Molecules with multiple ionizable centers may have very complex ionization graphs, and their complete traversal consumes significant computational resources, resulting in calculations being perceived as slow.
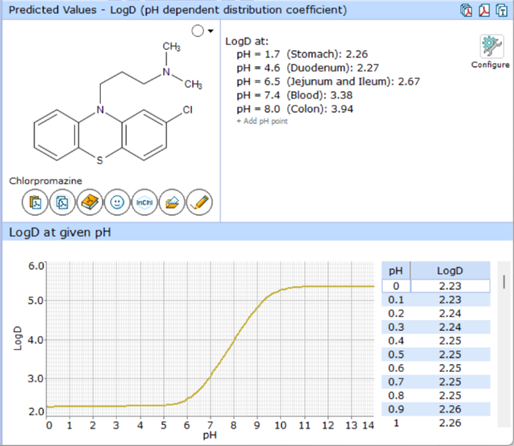
- Normalization error. Aggregating predictions from a large number of ionic forms necessitates using a special procedure for normalization of pKa micro-constants, which can lead to significant discrepancies between the shape of the simulated logD pH curve (Fig. 1), and the plot expected from the compound’s apparent pKa profile. This can cause confusion during analysis of prediction results, raising questions about the accuracy of the logD prediction itself.

LogD Algorithm
The logD value of a molecule at given pH depends on the logP of the neutral form, and the fractions of all ionic species present at that pH. Distribution of ionic species directly depends on all pKa micro-constants of the molecule. To calculate the distribution of ionic forms from pH, it is necessary to solve a non-linear system of equations for concentration values where pKa micro-constants are used as coefficients.
The new generation ACD/pKa Classic algorithm released with Percepta v2023 improved the accuracy of pKa predictions by the expansion of the training dataset by ~20%, and also addressed the calculation speed issue, resulting in up to 5–10-fold faster raw pKa predictions for complex multi-protic molecules.1 Dedicated optimizations helped to translate the speed improvement to other pKa-dependent properties, such as logD or logS.
The primary goal of the logD algorithm update in Percepta v2024 was minimizing the discrepancies in the shapes of the simulated logD vs. pH and charge vs. pH curves.
Problem: Normalization Error

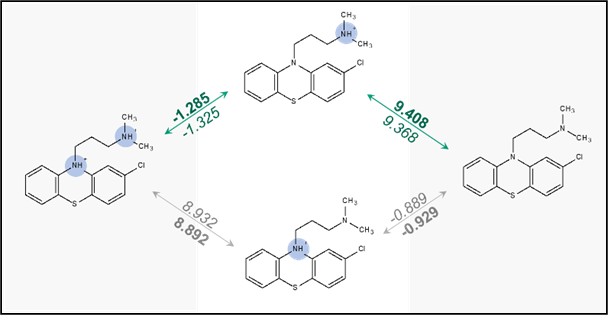
Bold – before normalization, italic – after normalization
Due to the excessive number of pKa micro-constants, in a multi-protic molecule, the system of equations is “overprovisioned” and does not have a single exact solution. Instead, the final “normalized” solution must be determined by least squares optimization. pKa micro-constants are also not exact but predicted with some error. Accumulating these prediction and normalization errors quite often leads to a situation where the distribution of ionic species, and subsequently, logD, etc., deviate significantly from the compound’s ionization profile as defined by predicted values of its “major” pKa micro-constants (see Fig. 2).
As shown in Table 1, logD values estimated using the normalized pKa micro-constants do not exactly match logD values back-calculated from logP and pKa. Even larger discrepancies are observed in the distribution of ionic forms, where the midpoint in the transition between positively charged and neutral form is somewhat shifted from the predicted pKa value of chlorpromazine.
TABLE 1. Deviations in logD and ionic form predictions introduced by normalization.
| pH | logD from logP & pKa |
logD v2022 |
logD Diff. |
pH | Positive Form Fraction (%) | ||
| From pKa | v2022 | Diff. | |||||
|---|---|---|---|---|---|---|---|
| 1 | 2.100 | 2.102 | 0.002 | 8.8 | 80.2 | 78.7 | 1.5 |
| 2 | 2.100 | 2.103 | 0.003 | 8.9 | 76.3 | 74.6 | 1.7 |
| 3 | 2.100 | 2.104 | 0.004 | 9.0 | 71.9 | 70.0 | 1.9 |
| 4 | 2.102 | 2.106 | 0.004 | 9.1 | 67.0 | 64.9 | 2.1 |
| 5 | 2.121 | 2.126 | 0.005 | 9.2 | 61.7 | 59.5 | 2.2 |
| 6 | 2.274 | 2.291 | 0.017 | 9.3 | 56.2 | 53.9 | 2.3 |
| 7 | 2.871 | 2.908 | 0.037 | 9.4 | 50.5 | 48.1 | 2.4 |
| 8 | 3.784 | 3.825 | 0.041 | pKa=9.408 | 50.0 | 47.7 | 2.3 |
| 9 | 4.650 | 4.682 | 0.032 | 9.5 | 44.7 | 42.4 | 2.3 |
| 10 | 5.101 | 5.112 | 0.011 | 9.6 | 39.1 | 36.9 | 2.2 |
| 11 | 5.189 | 5.193 | 0.004 | 9.7 | 33.8 | 31.8 | 2.0 |
| 12 | 5.199 | 5.202 | 0.003 | 9.8 | 28.9 | 27.0 | 1.9 |
| 13 | 5.200 | 5.203 | 0.003 | 9.9 | 24.4 | 22.7 | 1.7 |
| 14 | 5.200 | 5.203 | 0.003 | 10.0 | 20.4 | 18.9 | 1.5 |
Deviations are evident even for this relatively simple molecule that has only two ionizable centers, but they can be significantly more pronounced for more complex molecules with a large number of ionizable centers. This is particularly undesirable given that micro-constants of the major dissociation reactions, and consequently the apparent pKa values, are predicted very accurately.
In principle, it would be possible to discard minor microstages altogether to avoid slowdown and this additional source of errors. However, there are several reasons to retain them in the calculations:
- To identify which microstages are important, and which are not, all must be calculated anyway.
- The importance of microstages is relative, as “major” and “minor” micro-pKa for the same stage can be quite similar. Ignoring some of them may lead to loss of ionic forms with a significant presence in solution.
- For molecules with multiple ionizable centers, estimating the relevance of individual microstages is non-trivial, as any of them may turn out to be critical for the final solution.
Solution: Smart Normalization

The most viable approach to the problem was improving the normalization procedure itself, which led to the development of “Smart normalization” in Percepta v2024. The solution to the overprovisioned system of equations is still determined by minimizing the total error of all equations, but the new approach also takes the into account the relative “importance” of each microstage, ensuring that the most important micro-constants deviate less from the original values before normalization. The change in calculation results for Chlorpromazine is shown in Fig.3, where the numbers in italics now represent smart-normalized values.
Smart normalization brings pKa micro-constants for the most relevant dissociation reactions much closer to their initial values, leading to a significant reduction in discrepancies between logD curves estimated by different methods. The same applies to ionic form percentages, and most importantly, the midpoint (50.0%) is exactly at pH = pKa (Table 2).
TABLE 2. Improvement in accuracy of logD and ionic form predictions after smart normalization.
| pH | logD from logP & pKa |
logD v2023 |
logD Diff. |
pH | Positive Form Fraction (%) | ||
| From pKa | v2023 | Diff. | |||||
|---|---|---|---|---|---|---|---|
| 1 | 2.100 | 2.101 | 0.001 | 8.8 | 80.2 | 80.2 | 0.0 |
| 2 | 2.100 | 2.103 | 0.003 | 8.9 | 76.3 | 76.3 | 0.0 |
| 3 | 2.100 | 2.104 | 0.004 | 9.0 | 71.9 | 71.9 | 0.0 |
| 4 | 2.102 | 2.106 | 0.004 | 9.1 | 67.0 | 67.0 | 0.0 |
| 5 | 2.121 | 2.124 | 0.003 | 9.2 | 61.7 | 61.7 | 0.0 |
| 6 | 2.274 | 2.277 | 0.003 | 9.3 | 56.2 | 56.2 | 0.0 |
| 7 | 2.871 | 2.874 | 0.003 | 9.4 | 50.5 | 50.4 | 0.1 |
| 8 | 3.784 | 3.788 | 0.004 | pKa=9.408 | 50.0 | 50.0 | 0.0 |
| 9 | 4.650 | 4.653 | 0.003 | 9.5 | 44.7 | 44.7 | 0.0 |
| 10 | 5.101 | 5.105 | 0.004 | 9.6 | 39.1 | 39.1 | 0.0 |
| 11 | 5.189 | 5.192 | 0.003 | 9.7 | 33.8 | 33.8 | 0.0 |
| 12 | 5.199 | 5.202 | 0.003 | 9.8 | 28.9 | 28.8 | 0.1 |
| 13 | 5.200 | 5.203 | 0.003 | 9.9 | 24.4 | 24.3 | 0.1 |
| 14 | 5.200 | 5.203 | 0.003 | 10.0 | 20.4 | 20.4 | 0.0 |
Conclusion
- The updated logD algorithm in Percepta v2024 almost completely resolves the inaccuracies in logD curve calculations caused by the redundancy of the system of equations for pKa
- The same applies to ionic forms distribution at different pH values, as well as pKa or logD-dependent properties (Solubility-pH profile, absorption & bioavailability, pharmacokinetic parameters, etc.). The achieved improvements are also useful for chromatography applications.
- The changes in logD/ionic forms calculations complement significant improvements in pKa calculations available since Percepta v2023.
References
- Lanevskij K, Sazonovas A, Proskura A, Kolovanov E. Ionization (pKa) Prediction In Percepta v2023: Improvements and Evaluation. PhysChem Forum 2023, Gothenburg, Sweden, Oct. 3-4, 2023.

