Data Import
- You can now import data from the following formats:
- MS data from Bruker TIMS TOF (*.tsf)
- GC data from Shimadzu (*.gcd)
- We improved data import from:
- Standard BMRB bioNMR (*.seq and *.bmrb) biosequence structure and assignment data is now transferred to C-H correlation spectra (HSQC and HMQC), in addition to the previous N-H HSQC
Solvent Ratio Optimization Wave for RPLC
You can now optimize the solvent ratio when the strong phase can be represented as a mixture of two predefined solvents. These two predefined solvents can be pure or a mixture.
- Define possible primary organic phases and use enumeration to select the best pair of solvents
- Execute optimization using premixed solvents or dynamic mixing of solvents
- Optimize solvent ratio alone or in conjunction with gradient and temperature
- Keep track of your decisions from Solvent Screening, Mobile Screening, and the subsequent Solvent Ratio Optimization with improved navigation notes
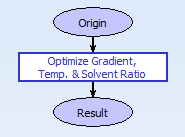
Add solvent optimization waves in AutoChrom and perform simulation or optimization of Solvent Ratio in LC Simulator using a quadratic model.
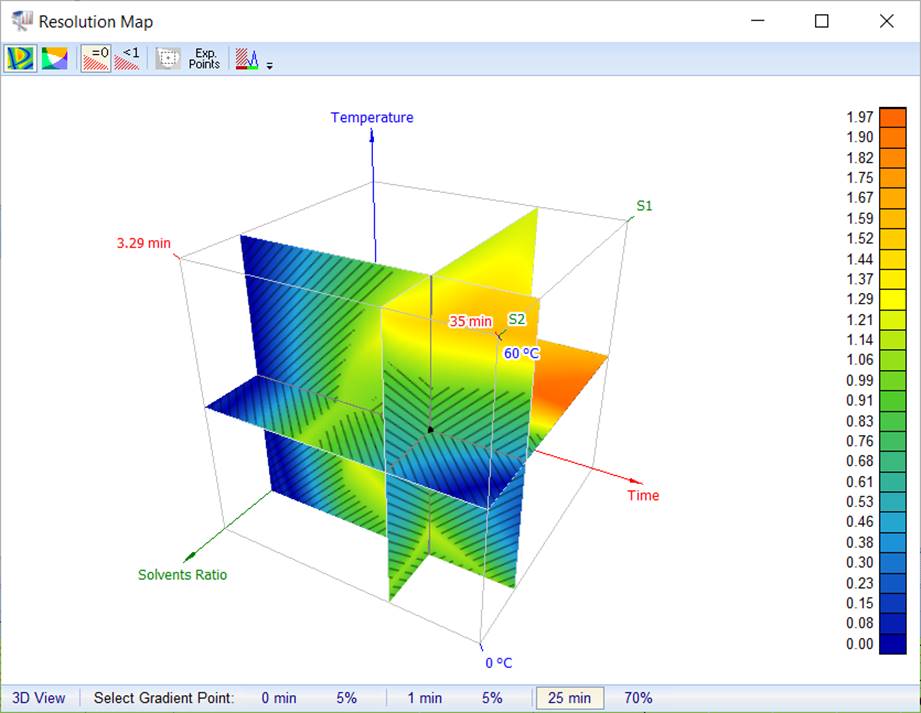
Simulate or optimize the Solvent Ratio in LC Simulator to create a 3D resolution map.
More Easily Screen Solvent Ratios
Dynamically mix ratios of strong solvents without adding additional bottles if using a quaternary pump
OpenLab CDS 2.8 now supported
Execute experiments with the newest version of OpenLab CDS released in 2024
Data Processing
Faster Processing of Unrejected LC/MS Signals
Improvements to IntelliXtract processing to only be applied on unrejected LC/MS signals
Ease of Use Improvements
- ChemStation users can automatically stop the software from analyzing the data or turn off the pump if the solvent volume falls below a specified value
- A more intuitive layout makes it easier to adjust instrument operation settings and simplified equilibration calculations
- Clarity has been added for Experiment Status allowing you to see the number of failed injections
- Color-coding allows you to see the active wave in the strategy
As always, you can process data from other analytical techniques in AutoChrom. We’ve improved features for these techniques as well:
Processing MS & Chrom Data with AutoChrom
Improved Display and Reporting of Structures on Chromatographic Traces
- You now have the option to selectively display structures on chromatographic traces, consolidating information in one place. This feature allows you to control which structures to display and include in reports.
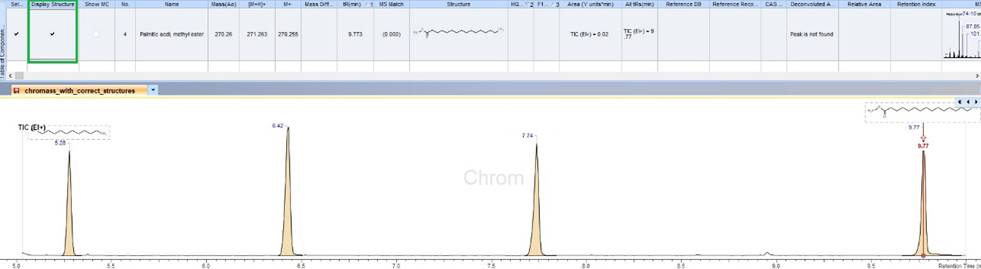
Display selected structure(s) on chromatographic traces.
Simplified Analysis with Reoccurring Ions
- You can now add reoccurring ions to the Component Interpretation Options, allowing you to automatically search and label reoccurring ions when assigning a component
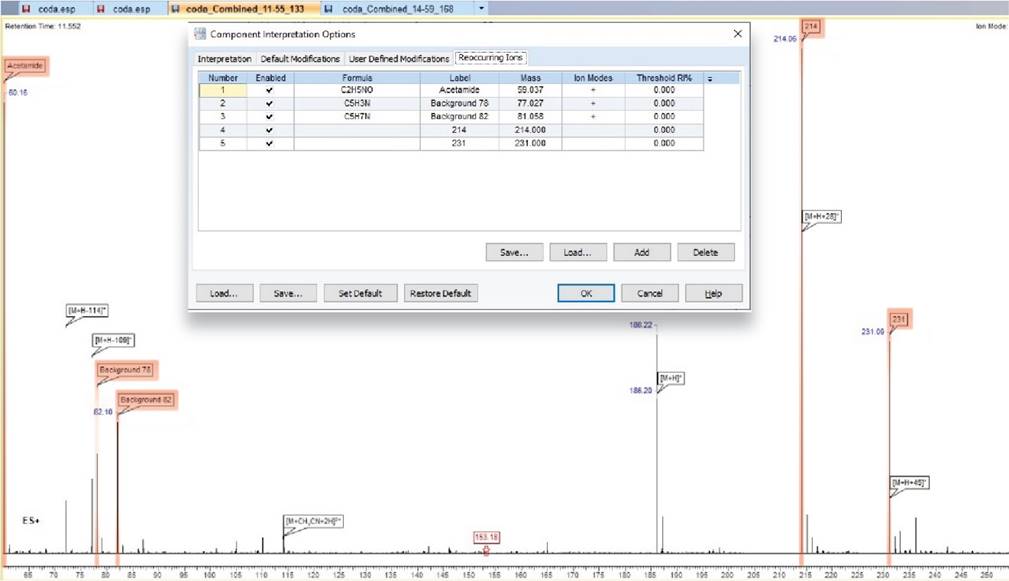
Highlighted ions are those populated in the reoccurring ions tab and are clearly labeled on the spectrum for ease of interpretation.
Greater Confidence in Identification with Improved MS Match Score
- You can now include multiply-charged ions and/or modifications into your MS Match score, giving you greater confidence in identification
Improved Features
Improvements in the Use of Internal Standards in Hyphenated Data Sets (LC/UV/MS, GC/MS)
- You can now calculate relative areas for all components if one component is selected as the internal standard
Easier Export of Components to Excel
- You now have the option to selectively push results including structure and molecular formulae from the Table of Components to Excel
Improved Accuracy in Area Calculations
- Using improved peak picking for XICs you can now manually adjust the border and/or baseline of peaks on XIC traces
Improved Efficiency of MS Data Processing
- You can now use preset options for Profiles to link instruments to specific accuracy, reporting, preferences, and script settings
- Set known parameters by instrument to minimize errors and improve efficiency
Improved Visualization of MS and UV Spectra
- You can now more easily review data with fixed positions for UV and MS Spectra
- Component Spectra are permanently fixed on the left and scan spectra are on the right
Improved Regulatory Compliance
You can easily store and visualize XIC accuracies and identify the accuracy used to extract XICs.
- Optionally display accuracies in the LC/UV/MS legend, in the chromatogram legend, and appended to the chromatogram name
- Visualize any accuracy changes in the History Record
- Store and display XIC accuracy in Spectrus DB, and visualize in reports
Ease of Use Improvements
- You can access all available options in mass spectral right-click menus at once
- Quickly restore your zoom with a new hotkey for zoom undo (“U”)
Processing NMR Data with AutoChrom
Option to Define the 1H Range of Multiplets Based on Peaks
- You now have the option to report the chemical shift range of multiplets based on the outermost peaks in the Multiplet Report Options dialog box, in addition to the boundaries of integration
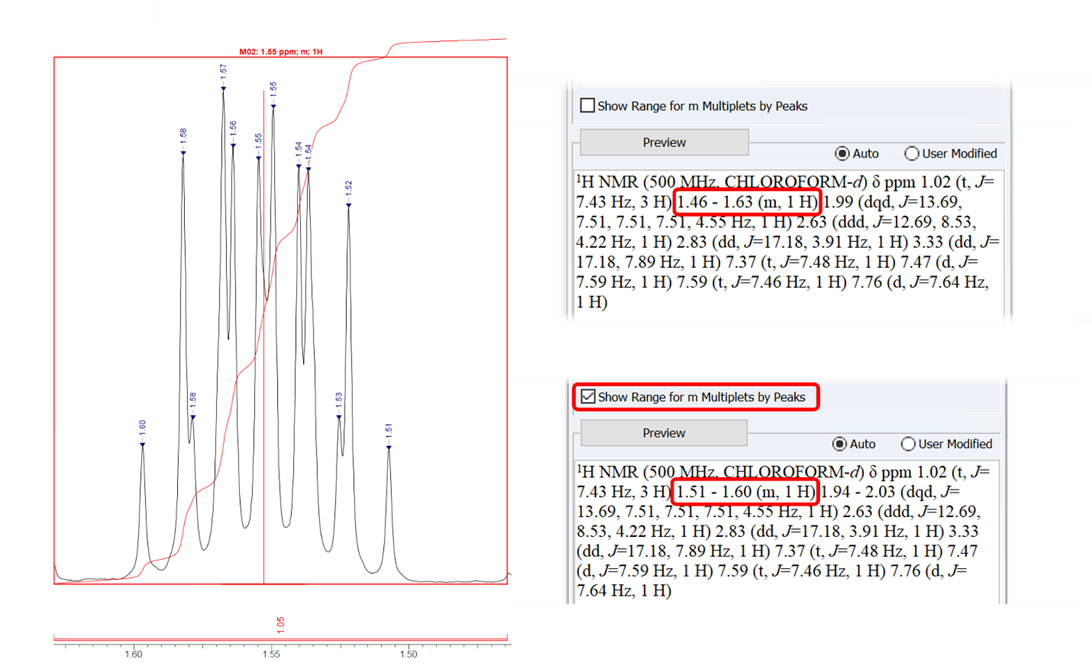 Choose to report multiplet ranges according to the outermost peaks or the boundaries of the integration—either 1.51–1.60 (m, 1H) for the outermost peaks with the option checked (above), or 1.46–1.63 (m, 1H) according to integration boundary (below).
Display Annotations of 1D Curves in 2D Spectra
- You now have the option to display the annotations of 1D curves in 2D NMR spectra
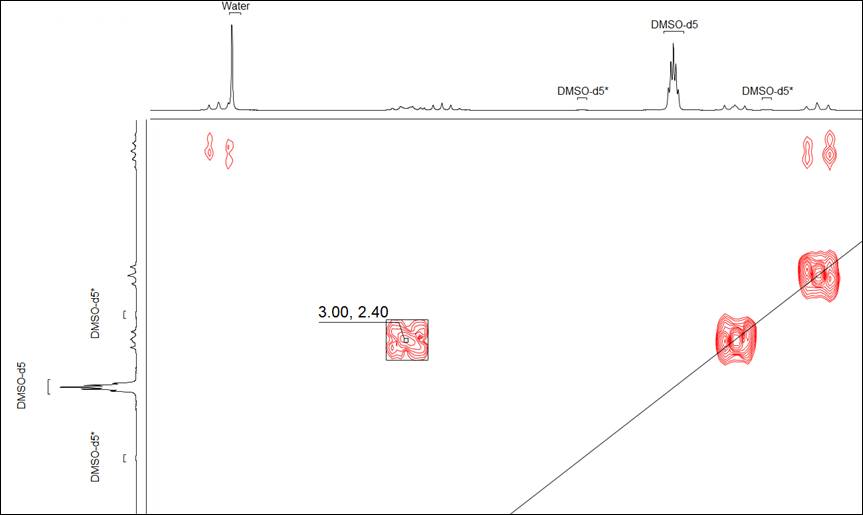
Show or hide the annotations of 1D curves in 2D NMR spectra.
Indication of Peaks Used for qNMR Calculation in Report
- You can now quickly identify which integrals are used in qNMR calculations with external standards in the Table of Integrals; which can now be included on the title page of the report
Option to Automatically Unfold HSQC Spectra for Structures with Si-CH3 Groups
- You now have the option to automatically unfold HSQC spectra along the F1 (13C) axis for structures with Si-CH3 This allows aliased peaks that are cut off to be picked properly.
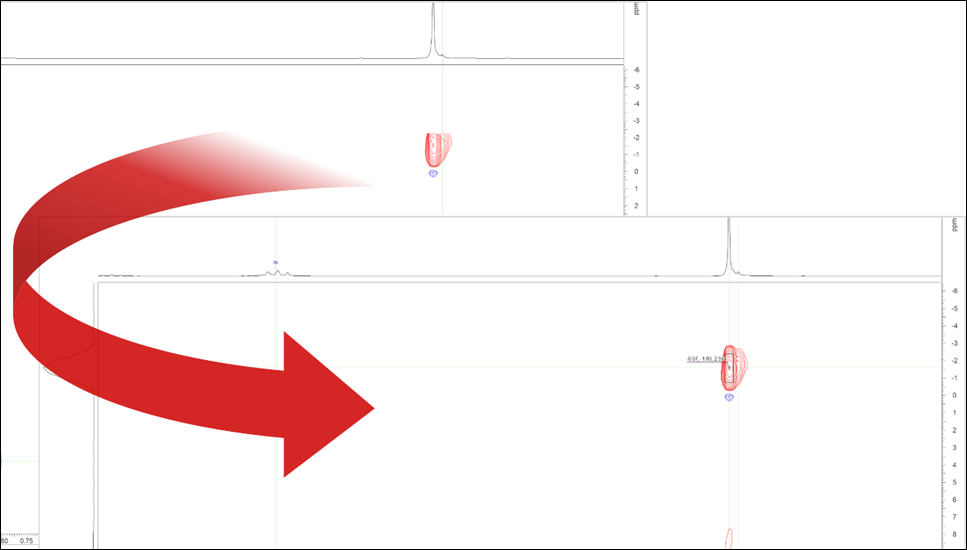
Automatically unfold HSQC spectra along the F1 for structures with Si-CH3 groups.
Improved Features
New Integral Normalization Method for NMR Spectra
- You can now more accurately normalize 1H integrals of samples with various impurities with the Allow Excess option
- This can help prevent false negatives in workflows like Automated Structure Verification (ASV)

The Allow Excess option method for 1H integral normalization can avoid under-estimated integrals when impurities are present in the sample, which helps prevent false negative results in ASV.
Perform External Standard Concentration Calculations Without a Sample Structure
- You now have the option to perform qNMR external concentration calculations in cases where the structure of the sample is not available. Do this by entering the molecular weight of the sample in the Concentration dialog box.
Improved Metrics for External Standard qNMR
- You can now calculate the relative sample purity by weight (w/w%) automatically with the Concentration Calculation tool
- You can now include the concentration calibration parameters in your report
Option to Show Only Unique J-Coupling Constants in the NMR Spectral Data Table
- You now have the option to show only unique coupling constants in the Spectral Data Table Advanced Options menu
- Instead of reporting a triplet as t(5.25, 5.25), it can now be reported as t(5.25)
Improved Reporting Functionality
- Ability to manually edit the NMR multiplet report text before copying to the clipboard or generating a report


